Portrait of Malik Akintola

Malik Akintola,
analytics engineer

I build data pipelines and the Power BI reports that sit on top of them.

This visit, measured live
Time here
0 sec
Furthest scrolled
0%
Sections seen
0 of 6
Your screen
–

Counted in your browser. Nothing is sent anywhere.

Selected projects

Three to start with. Each opens a full case study, with the live dashboard where one is published.
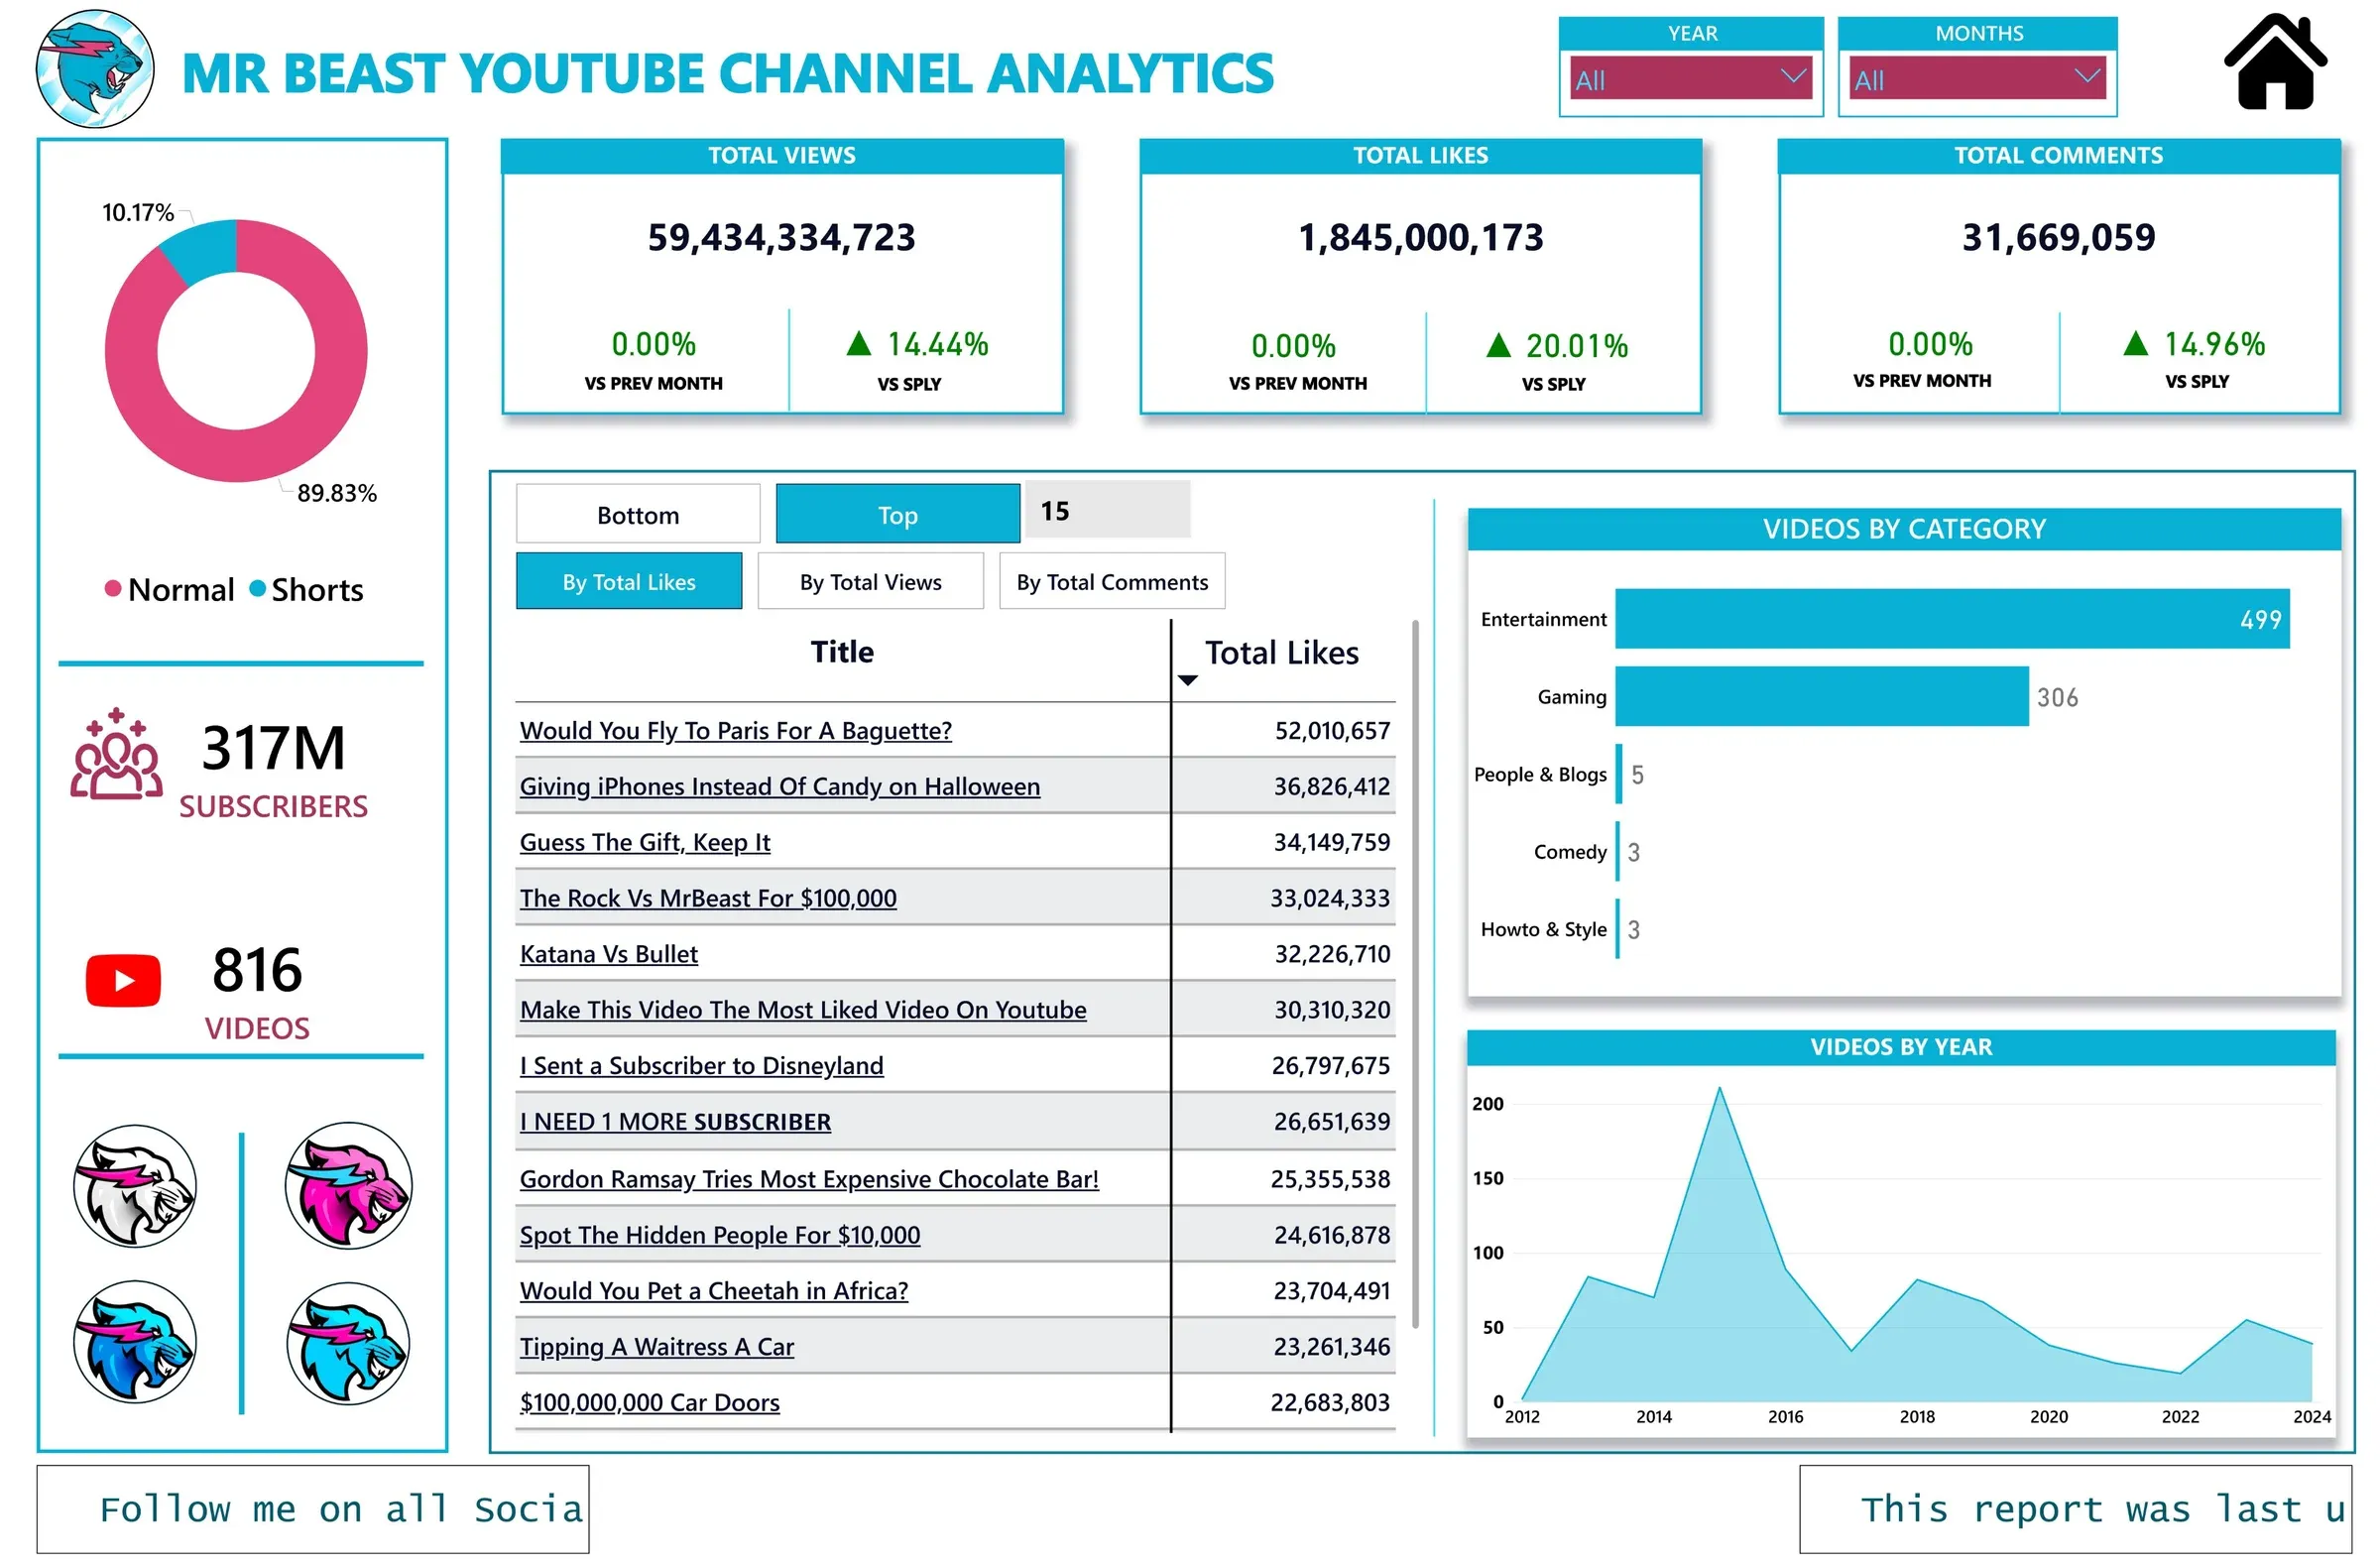
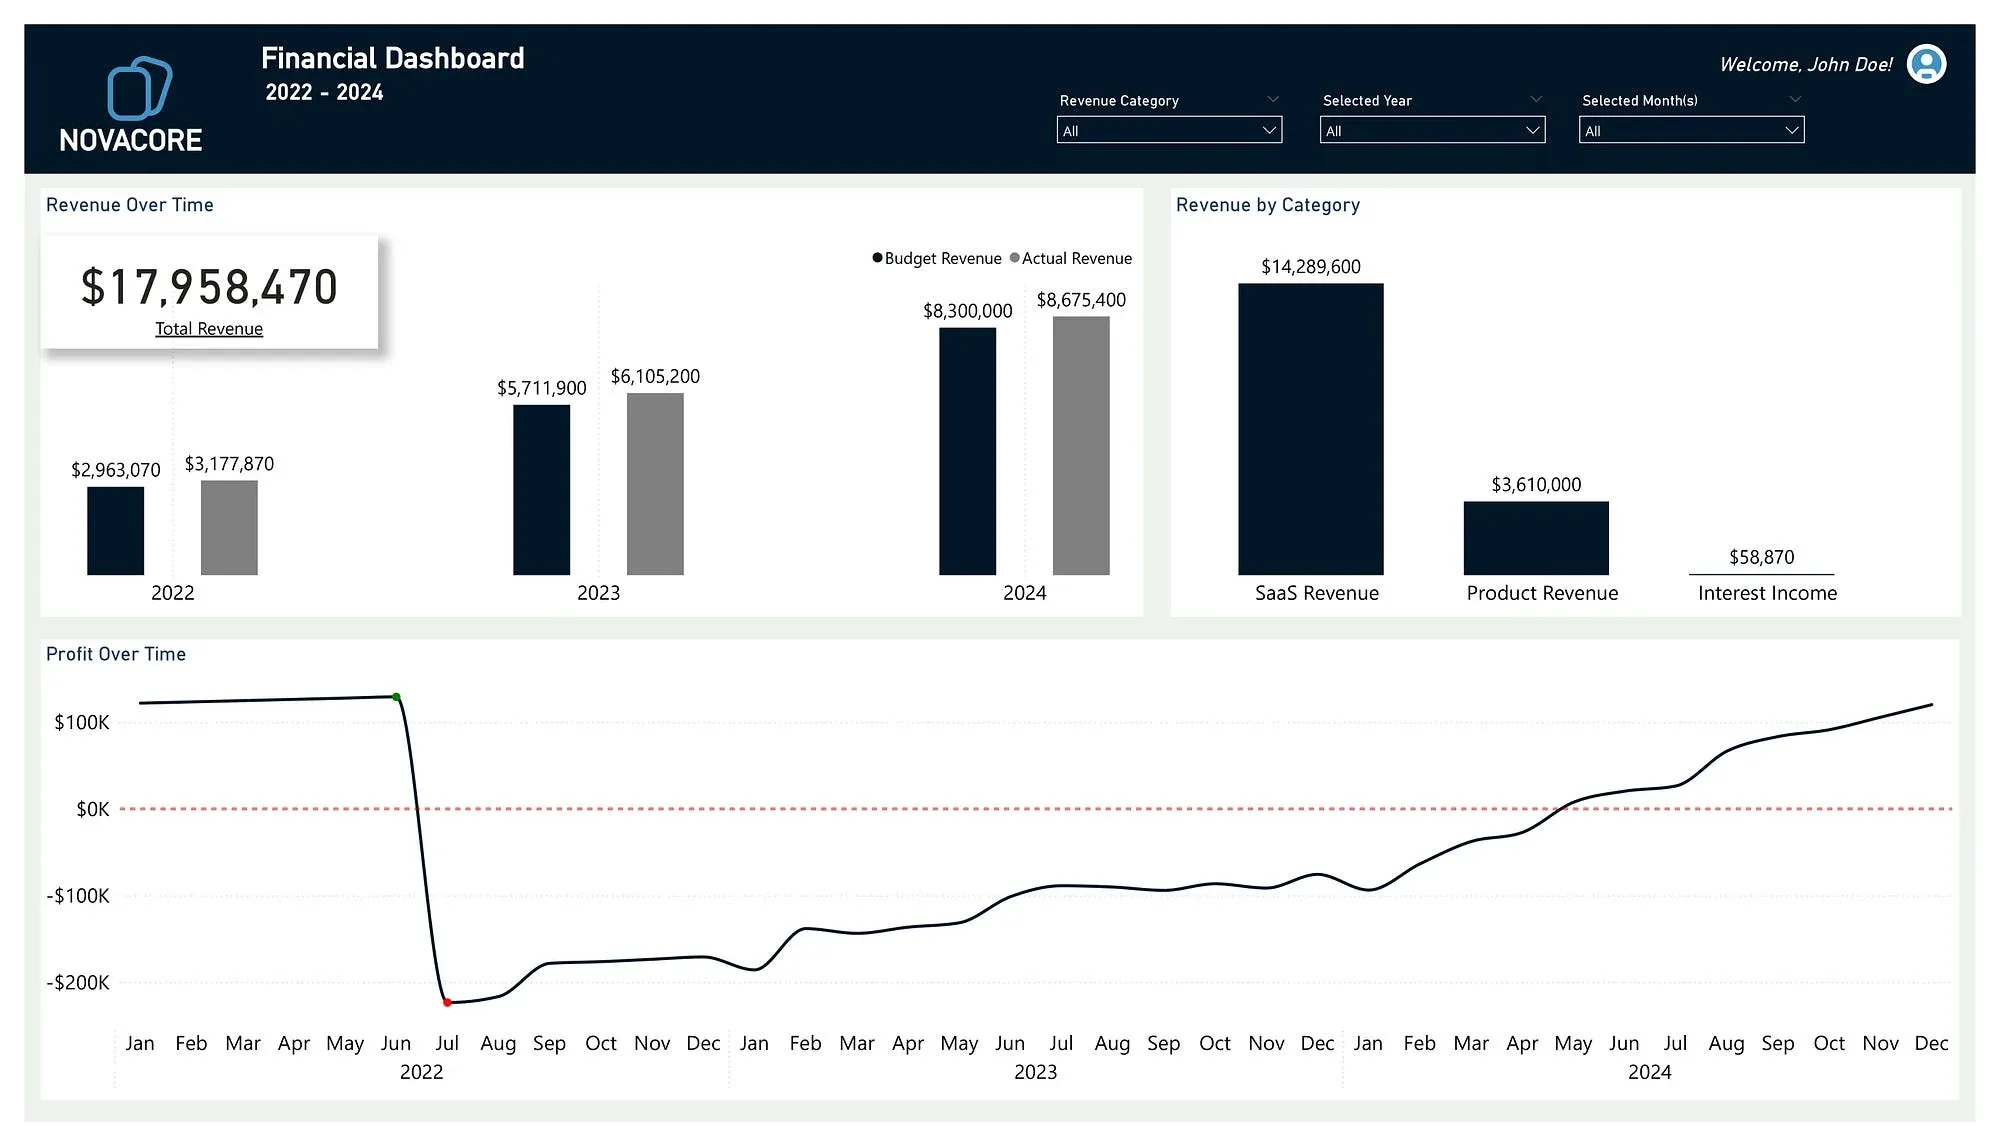
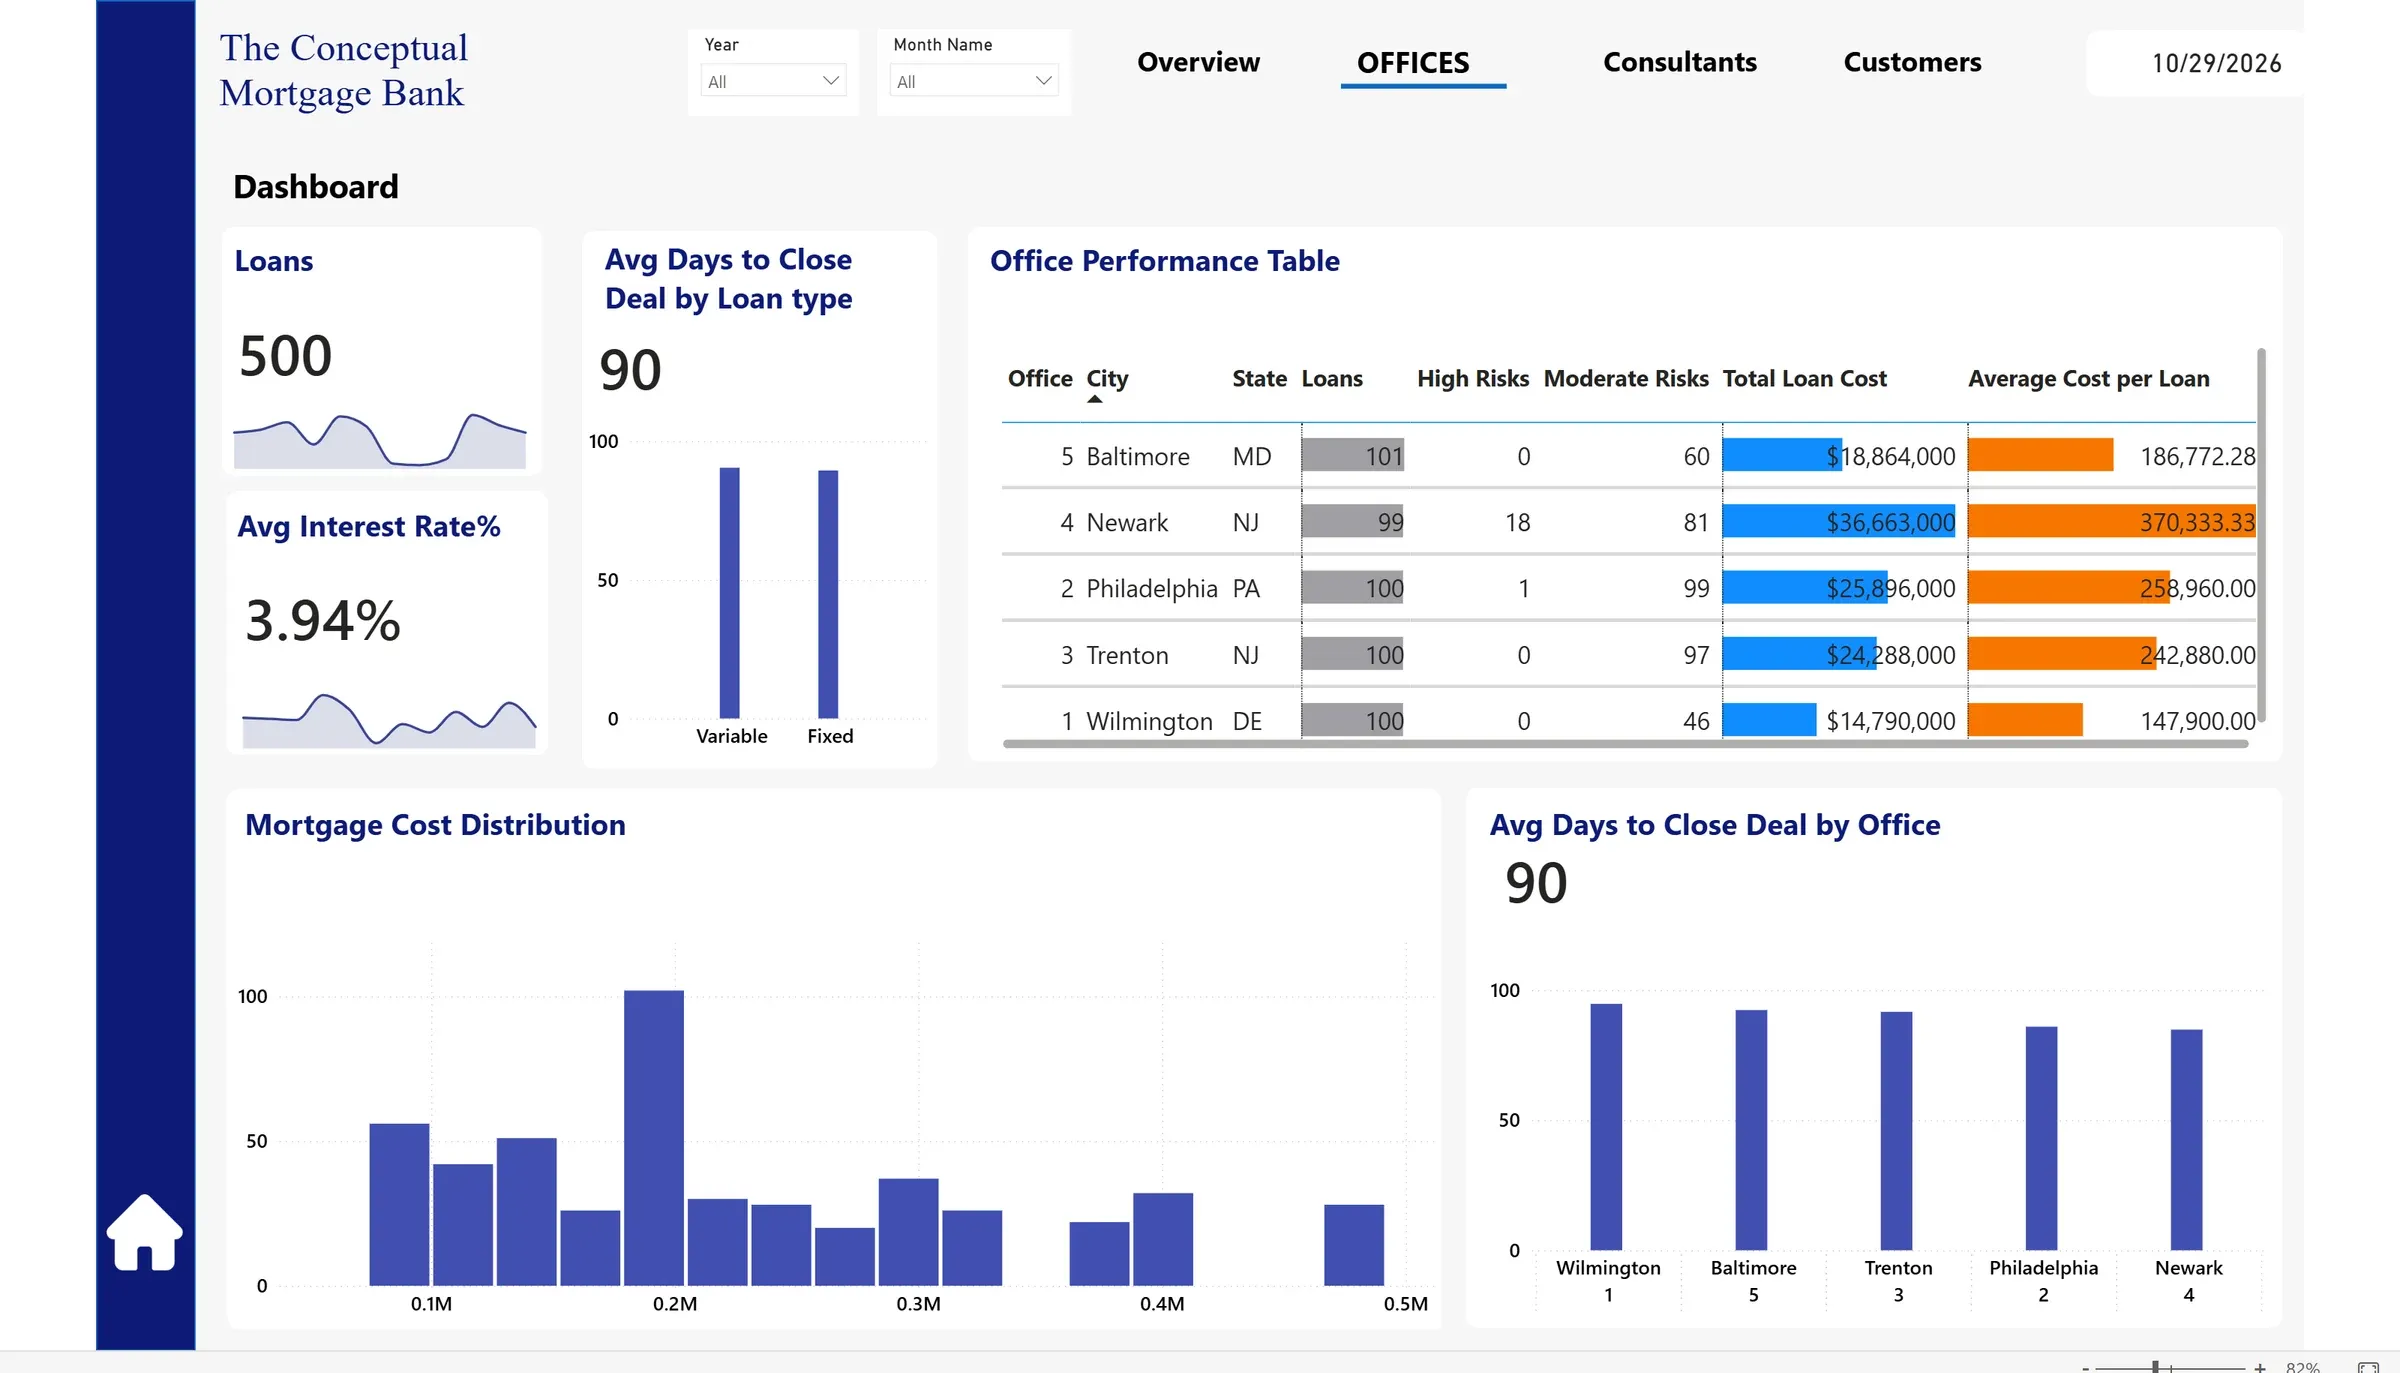
The MrBeast page of the YouTube report, with subscriber, view and like totals, the most engaging videos and a views trend.The Novacore revenue overview, with total revenue of $17,958,470 against target and a monthly revenue trend.The Offices page of the mortgage report, with loans, high-risk and moderate-risk counts, and total loan cost for each office.

6 channelsYouTube Analytics Pipeline. Scraped, modelled and compared through the YouTube API, and refreshing on its own in Microsoft Fabric.

+1,269%Novacore Financial Report. The month-on-month jump in expenses in July 2022, the month a profitable company made its first loss.

18 of 19Mortgage Portfolio Risk. High-risk loans in the portfolio that were written by one office, Newark.

See all 7 projects

About

Based in
Lagos, Nigeria
Degree
BSc Statistics, First Class, 4.73 / 5.0
Now
Data Analytics Engineer, Remita Payment Services

I trained as a statistician at the University of Lagos and graduated with First Class honours as the best student in my department. Today I work in data analytics engineering at Remita, keeping the pipelines behind payments reporting fast and correct.

Certified

Experience

Payments data at Remita, consulting for a microfinance bank, and more than 600 people taught. Open any role for the detail.

Read the full résumé or download it as a PDF.

Work

Data Analytics EngineerRemita Payment Services (SystemSpecs)Jul 2025 – now
  • Build and maintain SQL and Python pipelines that ingest, transform and model data from several source systems for reporting.
  • Find and fix data quality gaps across those systems, so payments and operations reporting can be trusted.
  • Tune queries and pipeline performance, manage access controls, and help monitor and debug production data processes.
  • Turn reporting needs from the BI and analytics teams into technical specifications for the data platform.
Data AnalystStandtech Digital SolutionsNov 2025 – Apr 2026
  • Diagnosed performance bottlenecks in the company’s data layer and fixed them, making the application faster for its users.
  • Worked with the product team to define analytical requirements and deliver insights that set product priorities.
Data AnalystQucoonJan 2025 – Apr 2025
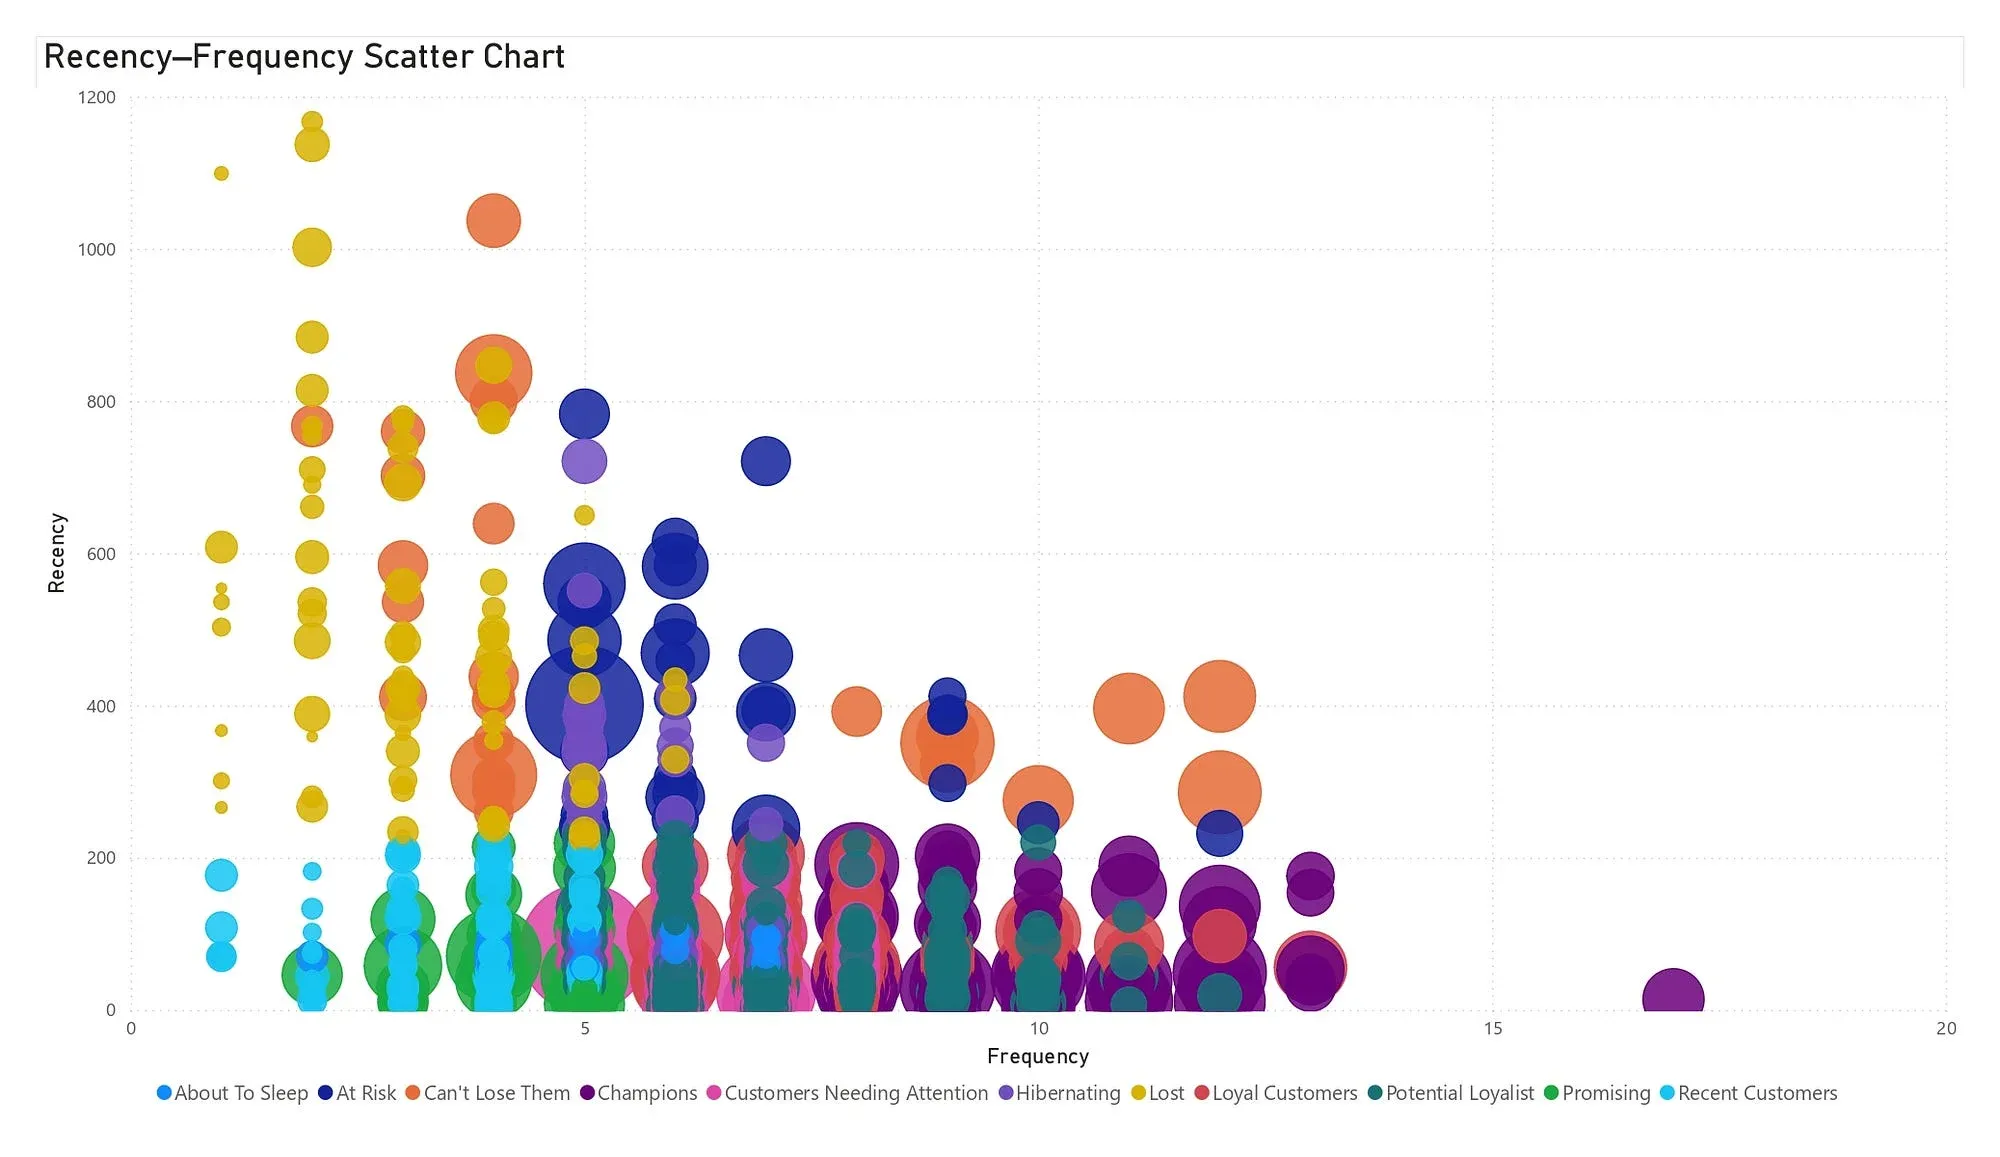
  • Segmented a microfinance bank’s customers by churn risk from demographic and transactional data, using RFM analysis and risk profiling. The recommendations shaped its retention campaign.
  • Built Power BI dashboards tracking cash inflows and outflows in real time, so the operations team could spot at-risk customers early.
  • Traced recurring downtime on a client’s digital platform through its QA data, cutting incidents by 30%.
Data Analyst InstructorHagital ConsultingJan 2024 – Jan 2025
  • Taught Excel, Power BI, SQL and Python to more than 600 learners, with the curriculum built around industry use cases.
  • Built and automated Power BI and Google Sheets dashboards for learner performance and participation.
  • Built a learner tracking and feedback system that cut manual admin work by 40%.
Data Analyst InternNITHUBApr 2023 – Dec 2023
  • Built automated pipelines in Python and Power Query for pricing and market research.
  • Modelled relational data into analysis-ready tables for internal teams.
  • Built Power BI dashboards to monitor food price trends, cutting repeated analysis work by 55%.

Teaching and volunteering

Data Analytics Track LeadEngineering Career ExpoOct 2023 – Aug 2024
  • Led a team of three running the Data and Analytics track for the whole programme.
  • Wrote all the Power BI teaching materials and taught 20+ students over eight weeks, with more than 80% completing.
Data Analytics InstructorThe Investment Society, University of LagosMay 2024 – Jun 2024
  • Ran a multi-session analytics course for members, framing data concepts in the language of investment research.
Power BI InstructorDSN AI InvasionJul 2023
  • Wrote the syllabus and materials, lectured, and graded coursework. 85% of the class completed the course.

Revenue picks the wrong customer

Customer A spent $575 once, 150 days ago. Customer B has spent $450 over eight orders, the last one ten days ago. It is the example I start with when I teach segmentation.

Move any slider and both rankings update at once.

Ranked by revenue

  1. Customer A$575
  2. Customer B$450

Ranked by RFM

  1. Customer ANoNoYes
  2. Customer BYesYesNo

Revenue puts Customer A first. RFM puts Customer B first.

Each customer wins a point for the more recent order, the more orders and the higher spend.

Read the article
Customer A
Customer B

Blog

How I work through analysis problems in Power BI and DAX, written so you can try them yourself.

See all 7 articles

Contact

Lagos, Nigeria. Available to work across time zones.

Hiring for a data role, or need a pipeline or a Power BI report built? I would like to hear about it.